The 80–130 km region of Venus’ atmosphere represents a key transition between superrotation and day-to-night circulation, yet remains poorly characterized by observations. Nevertheless, it is possible to study the Venus atmosphere dynamics by analyzing nightglow emissions as O2 and NO. Such emissions occur when atoms carried from the dayside to the nightside by the thermospheric circulation recombine during the gas descent to produce a molecule in an excited state that finally emits a radiation when relaxing to its ground state. Reproducing these observations in numerical models provides a better understanding of the dynamics on Venus.
Our colleague Antoine Martínez (leader of the work) and other team members use the latest version of the Venus Planetary Climate Model (Venus PCM or V-PCM), a ground-to-thermosphere global circulation model, to investigate possible scenarios relevant to future EnVision observations above the cloud tops. We performed sensitivity studies to evaluate the impact on our predictions of known tunable parameters (such as gravity wave drag, eddy diffusion coefficient, and not-well constrained chemical rate coefficients), with the aim of identifying possible sources of variability and understanding data-model biases.
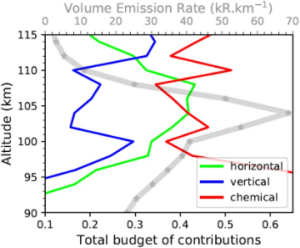
Figure 1: Vertical profiles of Volume Emission Rate of nightside O2 emission and relative contributions of main processes to O2 apparent motion modelled by the benchmark V-PCM case: chemical contributions (red), vertical contribution (blue), horizontal contribution (green).
This study provides a new insight of the V-PCM results and current observation-data-model biases of the Venusian night-side transition region (80–130 km). The simulations reproduce several observed phenomena, including strong zonal winds and large variability at low and high latitude on the nightside of Venus. This temporal variability is mainly attributed to chemistry and to horizontal transport (see Figure 1). However, the simulations overestimate the altitude of the O2 emission peak (104 km compared with 95–99 km according to observations), which is attributed to an underestimation of downward vertical transport. Below 100 km, our tests also underscore the critical role of trace species composition (notably Cl and H) in determining nightside atomic oxygen distribution, while also highlighting the significant uncertainties still present in their vertical profiles, particularly for O2, which remains poorly constrained by current observations.
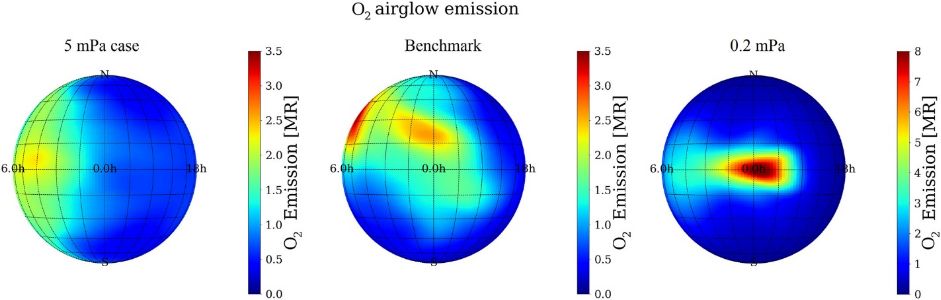
In parallel, the horizontal position (local time) of the emission peak is highly dependent on the stagnation point. The stagnation point (e.g., where the zonal wind converges to zero) predicted between 90 and 100 km, is also sensitive to the gravity waves parameterisation. In our simulation it is displaced toward the morning (evening) side when a westward (eastward) zonal flow is added, instead of being located at the anti-solar point as for a pure SS-AS circulation (see Figure 2).
Figure 2: Map of the vertically integrated O2 nightglow modelled by EPmul5 (left), benchmark (middle) and EPdiv5 (right) parameterisation. EPmul5 (EPdiv5) is the case where the maximum amplitude of the gravity waves is multiplied (divided) by a factor of 5 in comparison to the benchmark case.
The paper « New Insight on the Global Dynamics in the “Transition Region” of Venus Atmosphere (80–130 km) With a 3D Model » has been published on January 24, 2026 in Journal of Geophysical Research: Planets. (Link to paper: https://agupubs.onlinelibrary.wiley.com/doi/10.1029/2025JE009313)