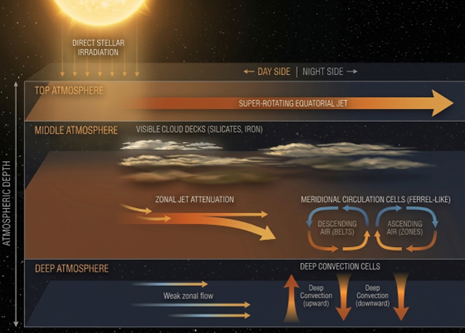
Similar to the planets in our Solar System, the atmospheres of exoplanets show complex winds and circulation patterns driven by planetary rotation and incoming heat from the host star. A particular class of large gas giant planets called hot Jupiters demonstrates incredibly strong winds, reaching several km/s, often in the form of an equatorial jet stream that redistributes heat from the day to the night side. These atmospheric motions depend on various parameters: the planet’s rotation period and mass, its atmospheric composition and temperature, etc. The strength and the structure of atmospheric flows that redistribute hot material also change with atmospheric altitude. This, however, is very difficult to constrain because the planets are too faint and the data currently does not provide sufficient spatial resolution. On the other hand, knowing how winds change with altitude is important to understand particle transport and heat redistribution mechanisms, chemical inhomogeneities, cloud formation, and of course, are essential to test modern circulation models under extreme atmospheric conditions.
The cover of this post is an artist’s representation of the atmospheric dynamic in a hot Jupiter. Different types of atmospheric motions are taking place at different altitudes, and each can be characterised with an individual flow pattern. Studying how these flows change atmospheric temperature and composition is key to inferring accurate properties of these planets and to understanding their formation and evolution pathways.
An international team of researchers led by the STESSy team (Shulyak et al. 2026 http://arxiv.org/abs/2608.0340) proposed a method to study the vertical structure of atmospheric flows using photometric phase curves obtained with various space missions. The idea is very simple and is based on the fact that atmospheric opacity depends strongly on wavelength. The stronger the opacity, the higher up in the atmosphere the outgoing radiation is formed. Consequently, the light at wavelengths where opacity is weak will originate from deeper atmospheric layers. Hence, comparing the light detected at various wavelengths naturally allows one to probe different altitudes.
To test the feasibility of this approach, the authors used a grid of General Circulation Models (GCM) and advanced radiative transfer algorithms to predict the emission from hypothetical planets at various photometric filters on board such space missions as TESS, CHEOPS, HST, Spitzer, and JWST.
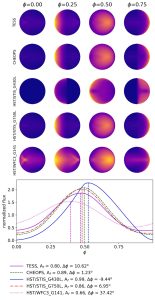
Figure 1. Example of synthetic phase curves. The brightness images of the planet surface are shown for the CHEOPS, TESS, and HST filters (brightness scale is linear). The bottom plot shows normalised phase curves, which are the planetary emission in individual photometric filters plotted as a function of rotation period. The predicted values of the shift of the light maximum and phase curve amplitudes are given in the figure’s legend below the plots (locations of the maximum of the phase curves are also marked with dashed lines on the plots). In each photometric wavelength, the light maximum occurs at different rotation phases, hence likely indicating the differences in heat redistribution at various atmospheric depths.
Additionally, the authors calculated specific quantities called light formation depths that allowed them to estimate the average altitude which contributes to the bulk radiation at individual wavelengths. This allowed them to choose a set of filters that have the best sensitivity to atmospheric flows in a wide range of altitudes. Based on the proposed analysis, the best tool to study the structure of atmospheric winds appears to be the set of filters offered by the JWST mission and its NIRCam instrument that can map atmospheric depths in wide range from tens of bar to millibars.
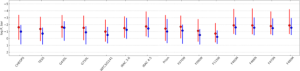
Figure 2. Example of light formation depths calculated in selected filters. Each point is the average over day (red) and night (blue) sides and over all models. The symbols mark the effective formation depths while horizontal lines mark minimum and maximum pressures probed by each filter.
Photometric technique is not the only one that has potential to look at various atmospheric altitudes. The authors also showed that the same goal can be achieved by using high-resolution spectroscopic observations in the infrared. The key idea here is to measure the strength and the displacement of molecular lines observed either at various spectroscopic bands (e.g., the famous H and K bands that contain numerous lines of CO and H2O), or at the lines of different molecules located at the same band.
This research concludes that modern space- and ground-based instruments already have the potential to resolve the vertical structure of winds in great detail, provided that a proper set of instruments and wavelengths is used.